Proactive Discovery

Catch it before
it catches fire.

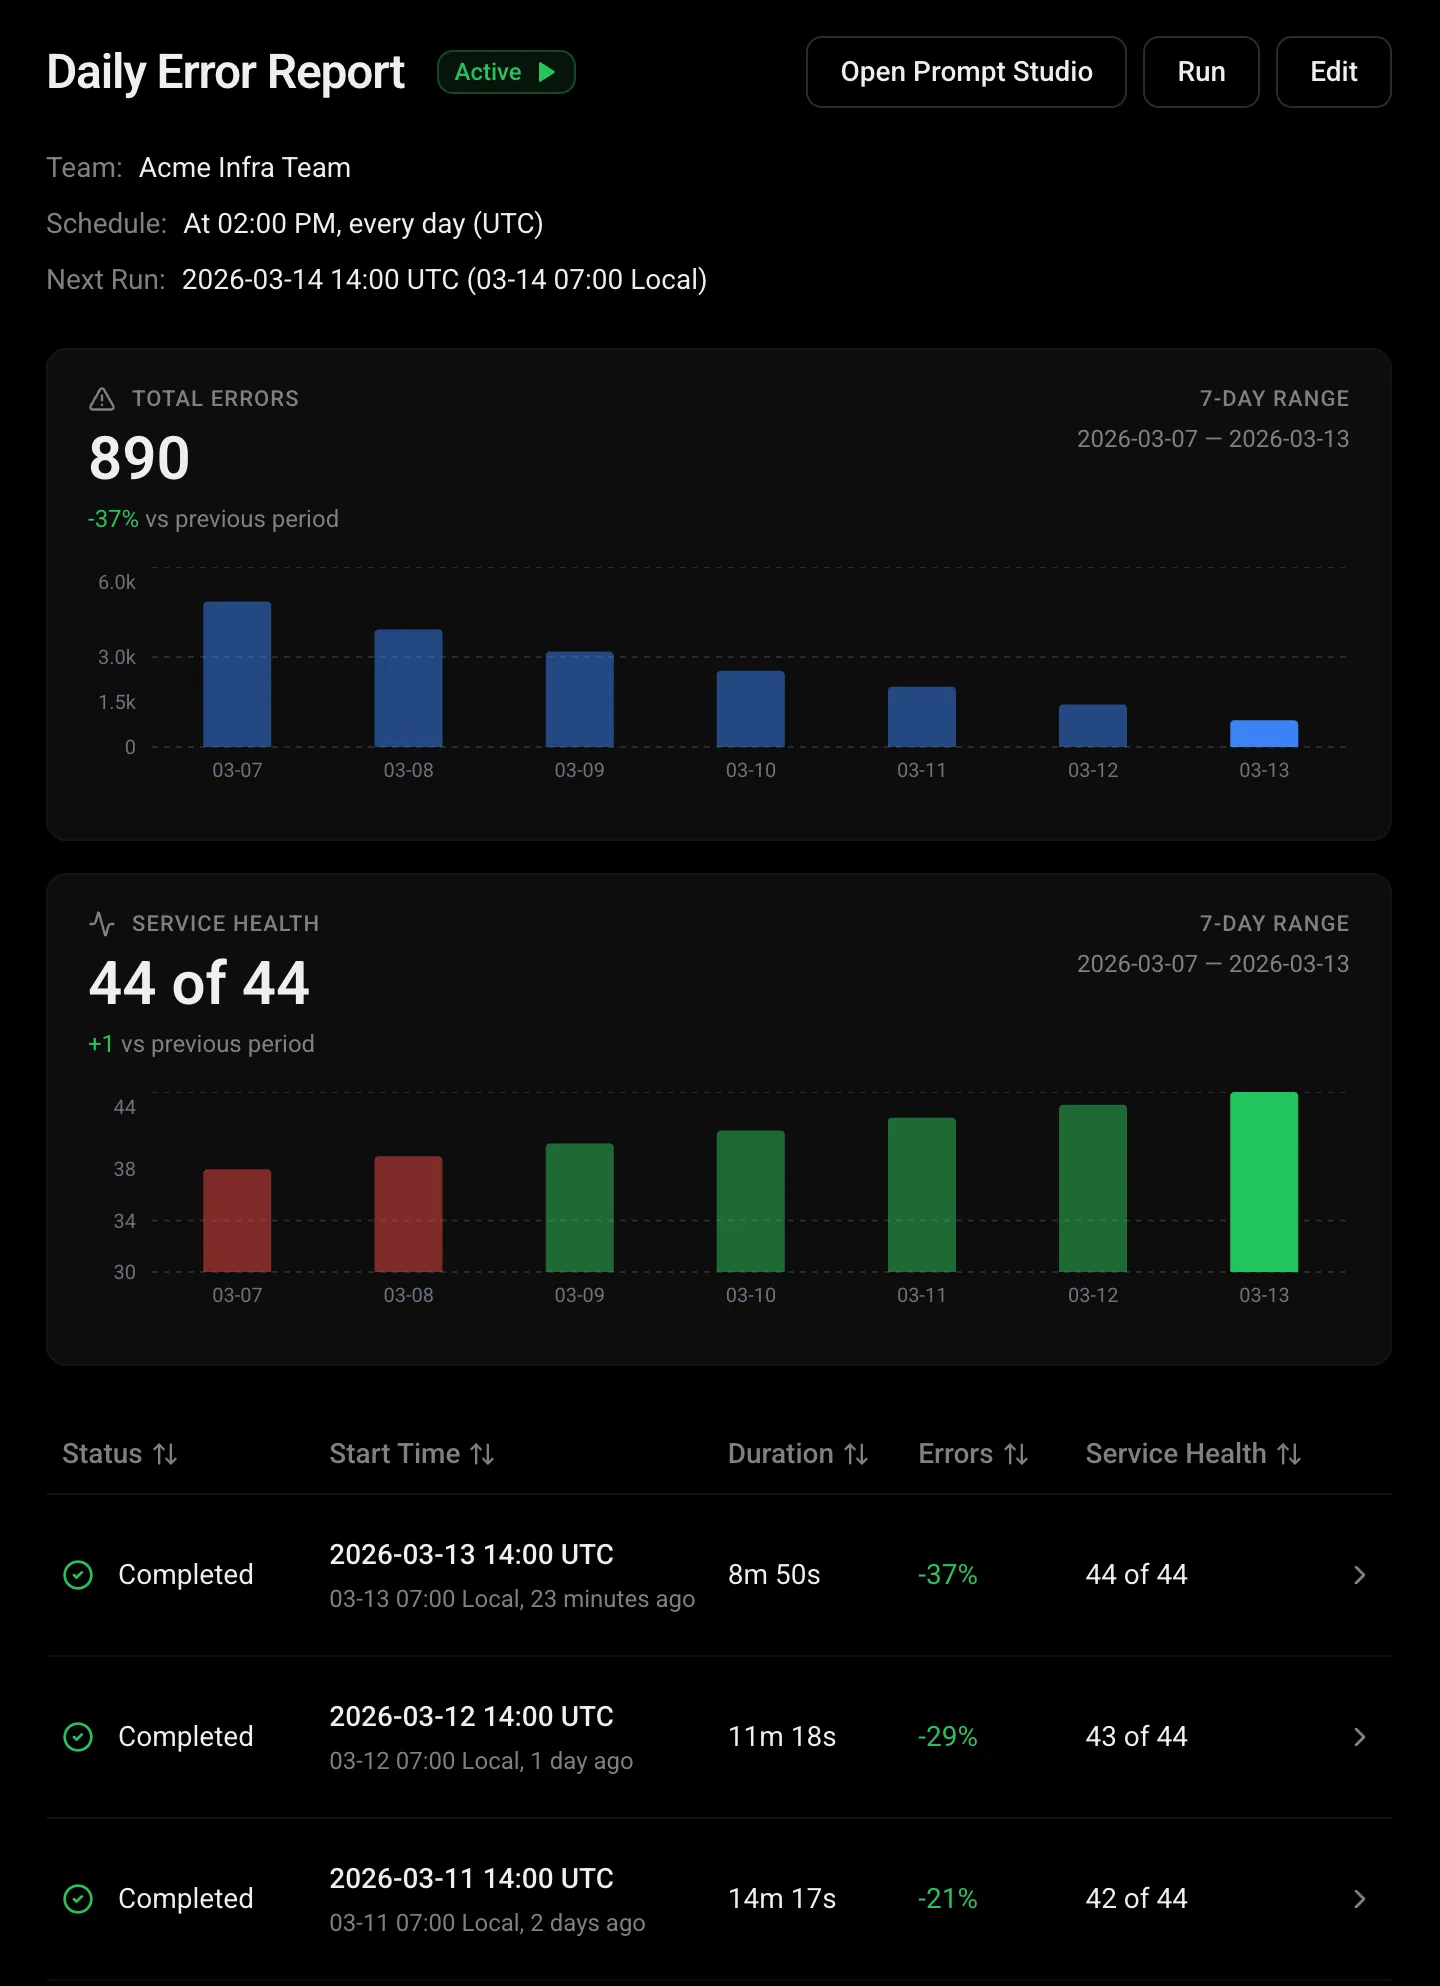
TierZero actively scans for reliability risks, performance degradation, and creeping observability costs that no alert would catch.

CONTINUOUS MONITORING

Watches what dashboards can't.

Surfaces slow degradation patterns that slip past threshold-based alerts and go unnoticed until something breaks.

Slow degradation detection

Catch latency creep and memory leaks before they trigger alerts.

Cross-service correlation

Individual metrics look fine. Together, they tell a different story.

Historical trend analysis

Compare against baselines from weeks ago, not just hours.

SLO burn rate monitoring

Catch error budget depletion before it breaches your SLO thresholds.

Proactive Discovery
Monitoring
Last scan: 3 min ago
Services Healthy
47/52
5 in amber
Issues Found
3+2 since last week
1 new today
Risk Score
Low
22/100
Detected Issues3 active
Gradual memory leak in user-servicemedium

Heap usage growing linearly since deploy v3.8.2. At current rate, OOM kill expected within 4 days. Likely cause: unclosed DB connections in the session refresh path.

user-serviceTrend: +12% over 7 days·Pattern analysis·7d agoInvestigate heap
Latency p99 creep on checkout-apihigh

P99 latency drifting upward since Jan 28. Trace analysis shows increased time in inventory-check span. Correlated with 18% growth in catalog size — query is not paginated.

checkout-apiTrend: 340ms → 520ms over 14 days·Baseline drift·14d agoReview traces
Elevated error rate on search-servicemedium

Intermittent 503s from Elasticsearch cluster. Node es-data-03 showing elevated GC pauses. Pattern matches pre-incident behavior from INC-892.

search-serviceTrend: 0.2% → 0.8%·Anomaly·5d agoView errors
47 healthy
5 amber
0 critical
Next scan in 12 min
Proactive Discovery
LAST 30 DAYS
AllCostPerformanceErrors3 anomalies detected
CostAWS spend spike on compute cluster
3d ago
Expected$12.4K/day
Actual$18.7K/day
Impact+$6.3K/day

Daily compute spend broke out of the normal band 3 days ago after deployment v4.2.1 modified the auto-scaling policy. The new minimum instance count of 8 (previously 3) is running during off-peak hours when traffic doesn't justify it. Projected monthly overspend: $189K if uncorrected.

Correlated with: deployment v4.2.1 (auto-scaling policy change)
PerformanceP99 latency regression on payment-service
Baseline120ms
Current340ms
Duration5 days

P99 latency jumped from 120ms to 340ms starting Jan 28. Trace analysis shows the regression is concentrated in the validate-payment span, where a new N+1 query was introduced. Each transaction now issues 12-15 individual DB lookups instead of a single batched query. No alert fired because P50 remains within SLO.

Root cause: N+1 query introduced in commit a3f29bc
ErrorsElevated 429s on rate-limited endpoints
Normal0.1%
Current2.4%
TrendIncreasing

429 rate on api-gateway climbed from 0.1% to 2.4% over the past 5 days. A single tenant (org_8f3a) is responsible for 78% of the throttled requests. Their integration webhook is retrying on 429s without backoff, creating a feedback loop that's crowding out other tenants.

0.1%
2.4%
Affects: api-gateway, checkout-api, search-service, order-service
ANOMALY DETECTION

Finds the problem hiding in plain sight.

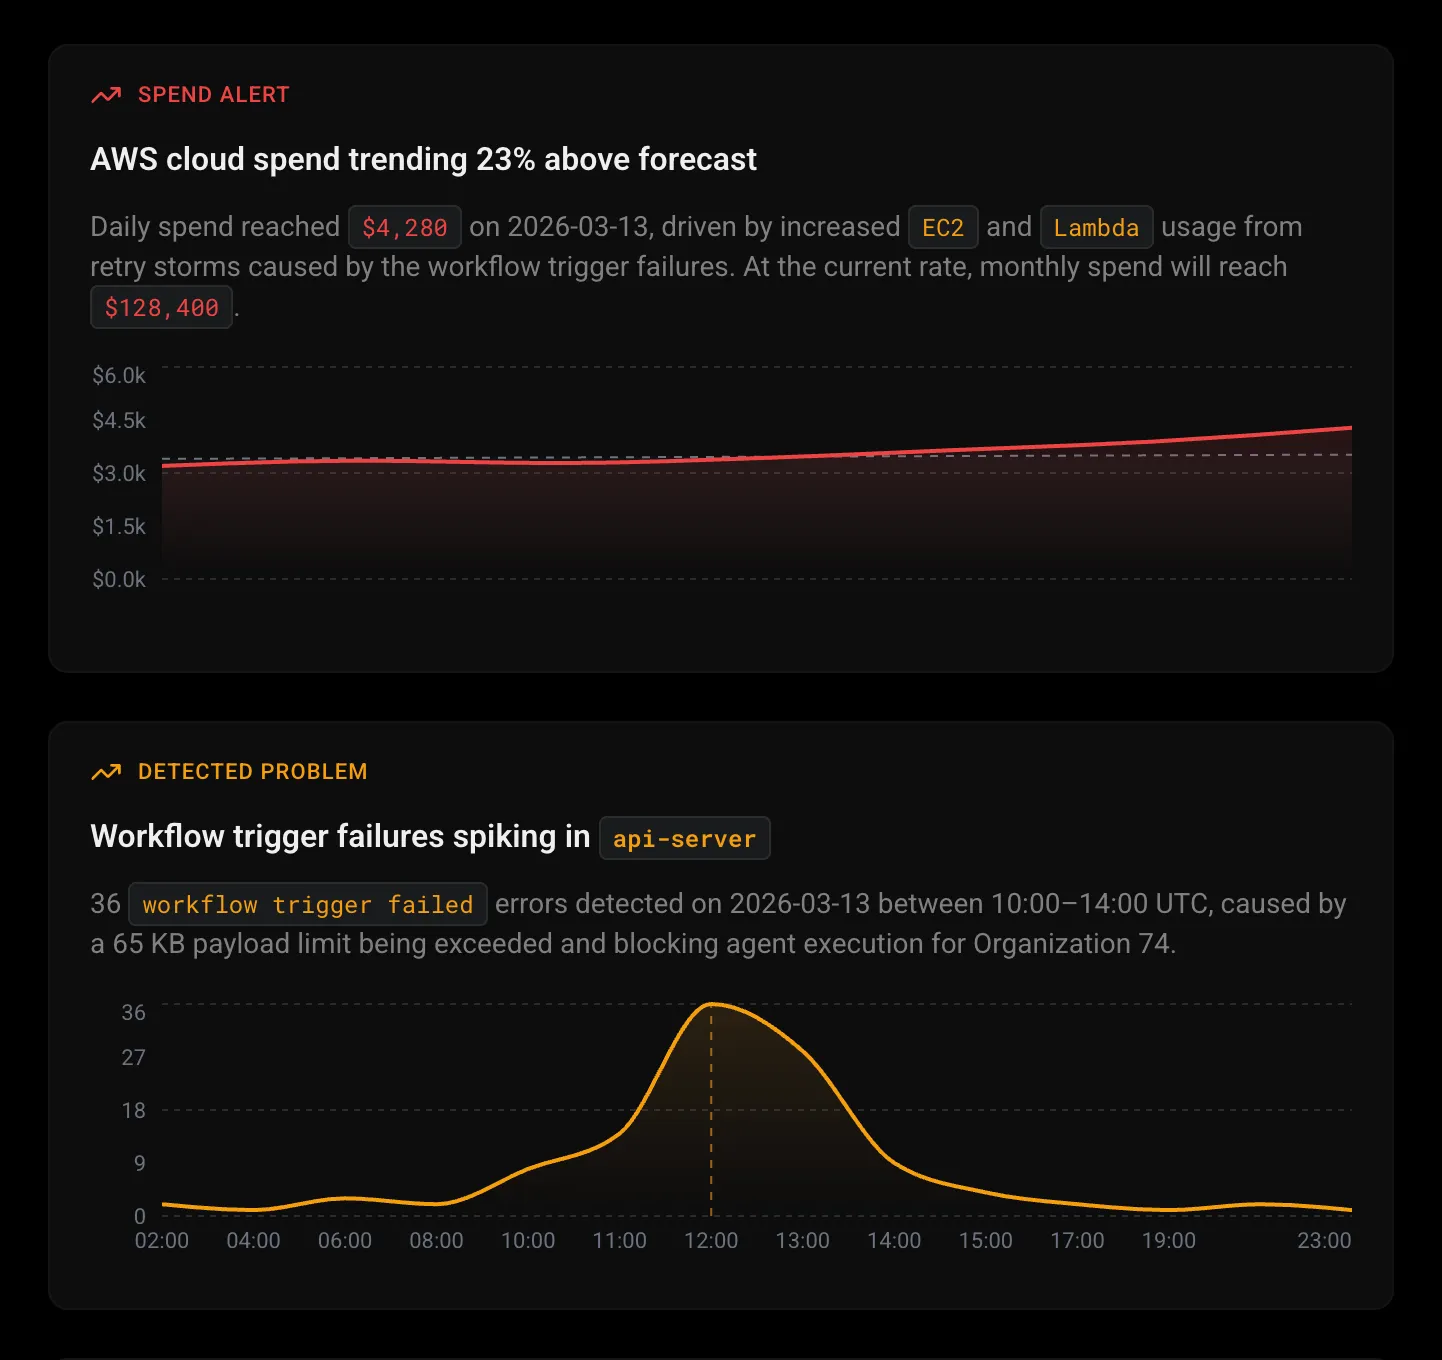
Detects unusual spend spikes, latency creep, and rising error rates before they compound into outages. Each anomaly comes with context and a suggested next step.
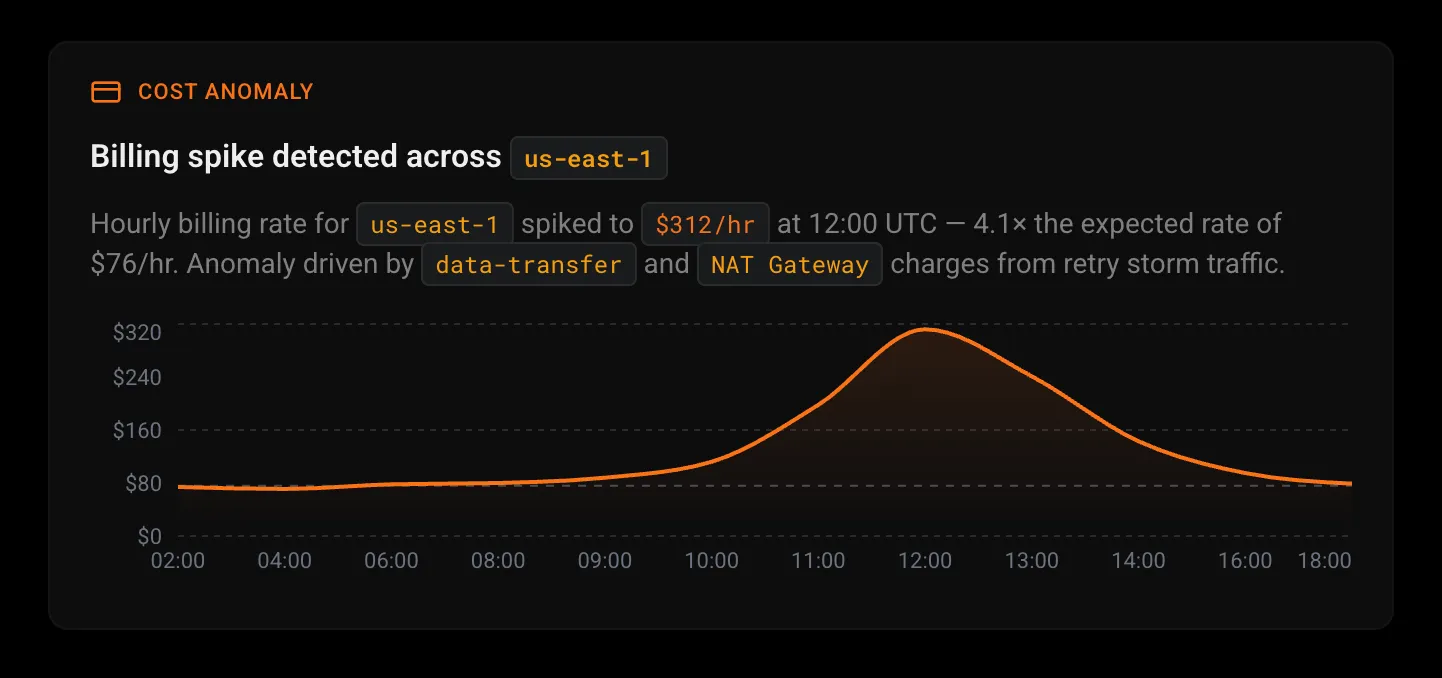
Cost anomalies

Catch unexpected spend increases before they hit your cloud bill.

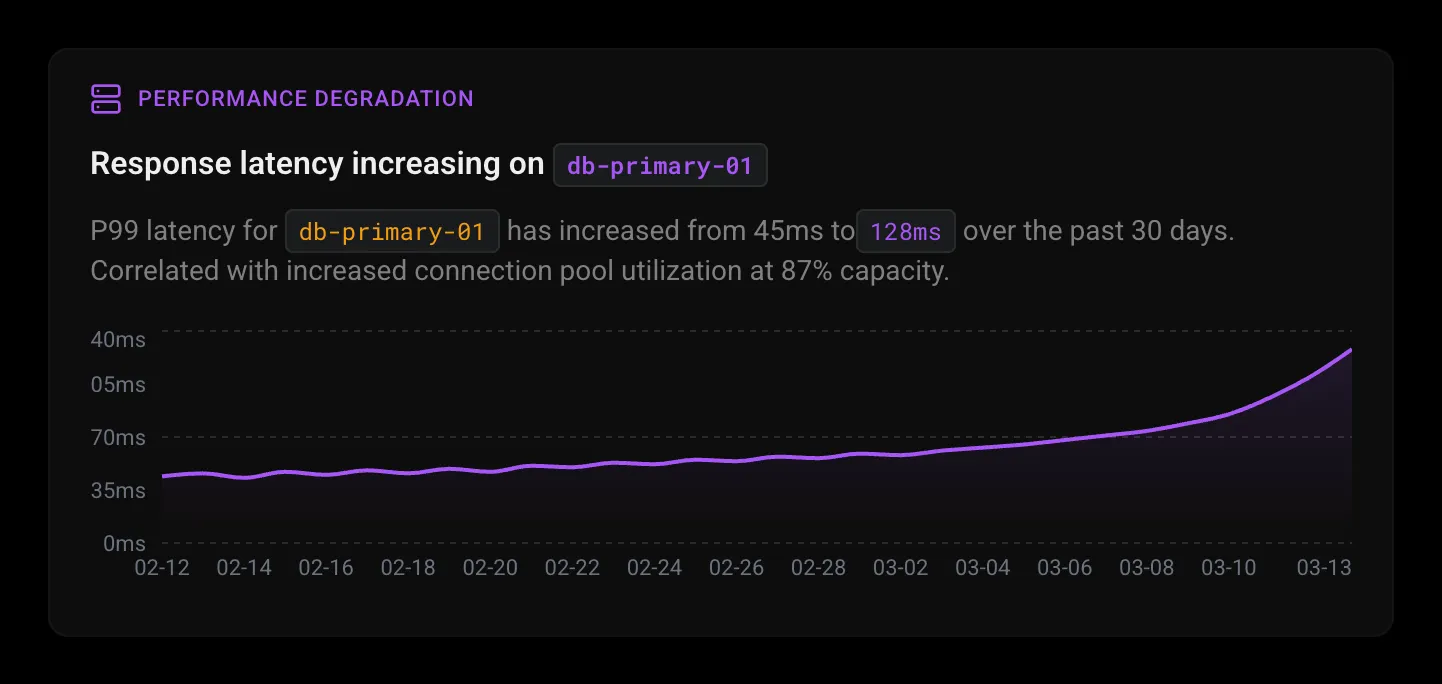
Performance regression

Surface latency trends and throughput drops — with the commit that caused them.

Error rate analysis

Track error patterns and correlate with deployments and infrastructure changes.

PRE-DEPLOY RISK

Correlate deploys with degradation.

Correlates recent deploys with performance regression. Identifies which commit introduced latency, error rate spikes, or resource anomalies before they become incidents.

Deploy-correlated regression detection

Automatically links performance degradation to specific deployments and commits.

SLO burn rate monitoring

Catch error budget depletion before it breaches your SLO thresholds.

Pre-merge risk scoring

Surface high-risk changes based on historical deployment failure patterns.

Deploy Risk Analysis
RISK DETECTED
Recent DeploysLast 72 hours
v2.4.03d agojchen · 12 files
v2.4.12d agomkumar · 34 filesSuspected
v2.4.218h agoslee · 5 files
Correlated Metrics
P99 Latency+340ms
Baseline: 94msCurrent: 435ms
Error Rate+2.3%
Baseline: 0.3%Current: 2.5%
Suspected Root Cause

Regression correlated with commit abc123f in payment-service. Modified connection pool settings reduced max connections from 50 to 10, causing request queuing under load.

Commit abc123f by mkumar · 2d ago
Cost Intelligence
LAST 30 DAYS
Daily Cloud Spend
Avg: $82.1K/dayAnomaly detected
Top Services
ServiceMonthlyChangeShare
EC2$142.3K+12%
RDS$67.8K+3%
Lambda$31.2K-8%
S3$24.6K+1%
EKS$18.9K+22%
Savings Opportunities
$47.0K/mo
prod-worker-poolOver-provisioned
$18.2K
staging-db-clusterIdle replica
$14.7K
data-pipeline-gpuLow utilization
$9.4K
cache-fleet-us-eastRight-size
$4.7K
COST INTELLIGENCE

Find the waste your dashboards hide.

Proactive Discovery scans for cost anomalies, billing spikes, and over-provisioned resources across your cloud infrastructure. Surface capacity trends and resource utilization patterns before they become incidents.

Billing anomaly alerts

Detect unexpected cost spikes across cloud providers before they hit your monthly bill.

Resource utilization analysis

Identify over-provisioned and under-utilized resources across your infrastructure.

Auto-scaling policy drift

Detect when scaling policies diverge from actual usage patterns.

Capacity trend monitoring

Surface capacity trends and resource utilization patterns before they become incidents.

Real impact on real infrastructure.

$150K+

Annual Savings

Read the Eaze story →

7x

Faster Detection

vs dashboard monitoring

Find what your monitoring misses.